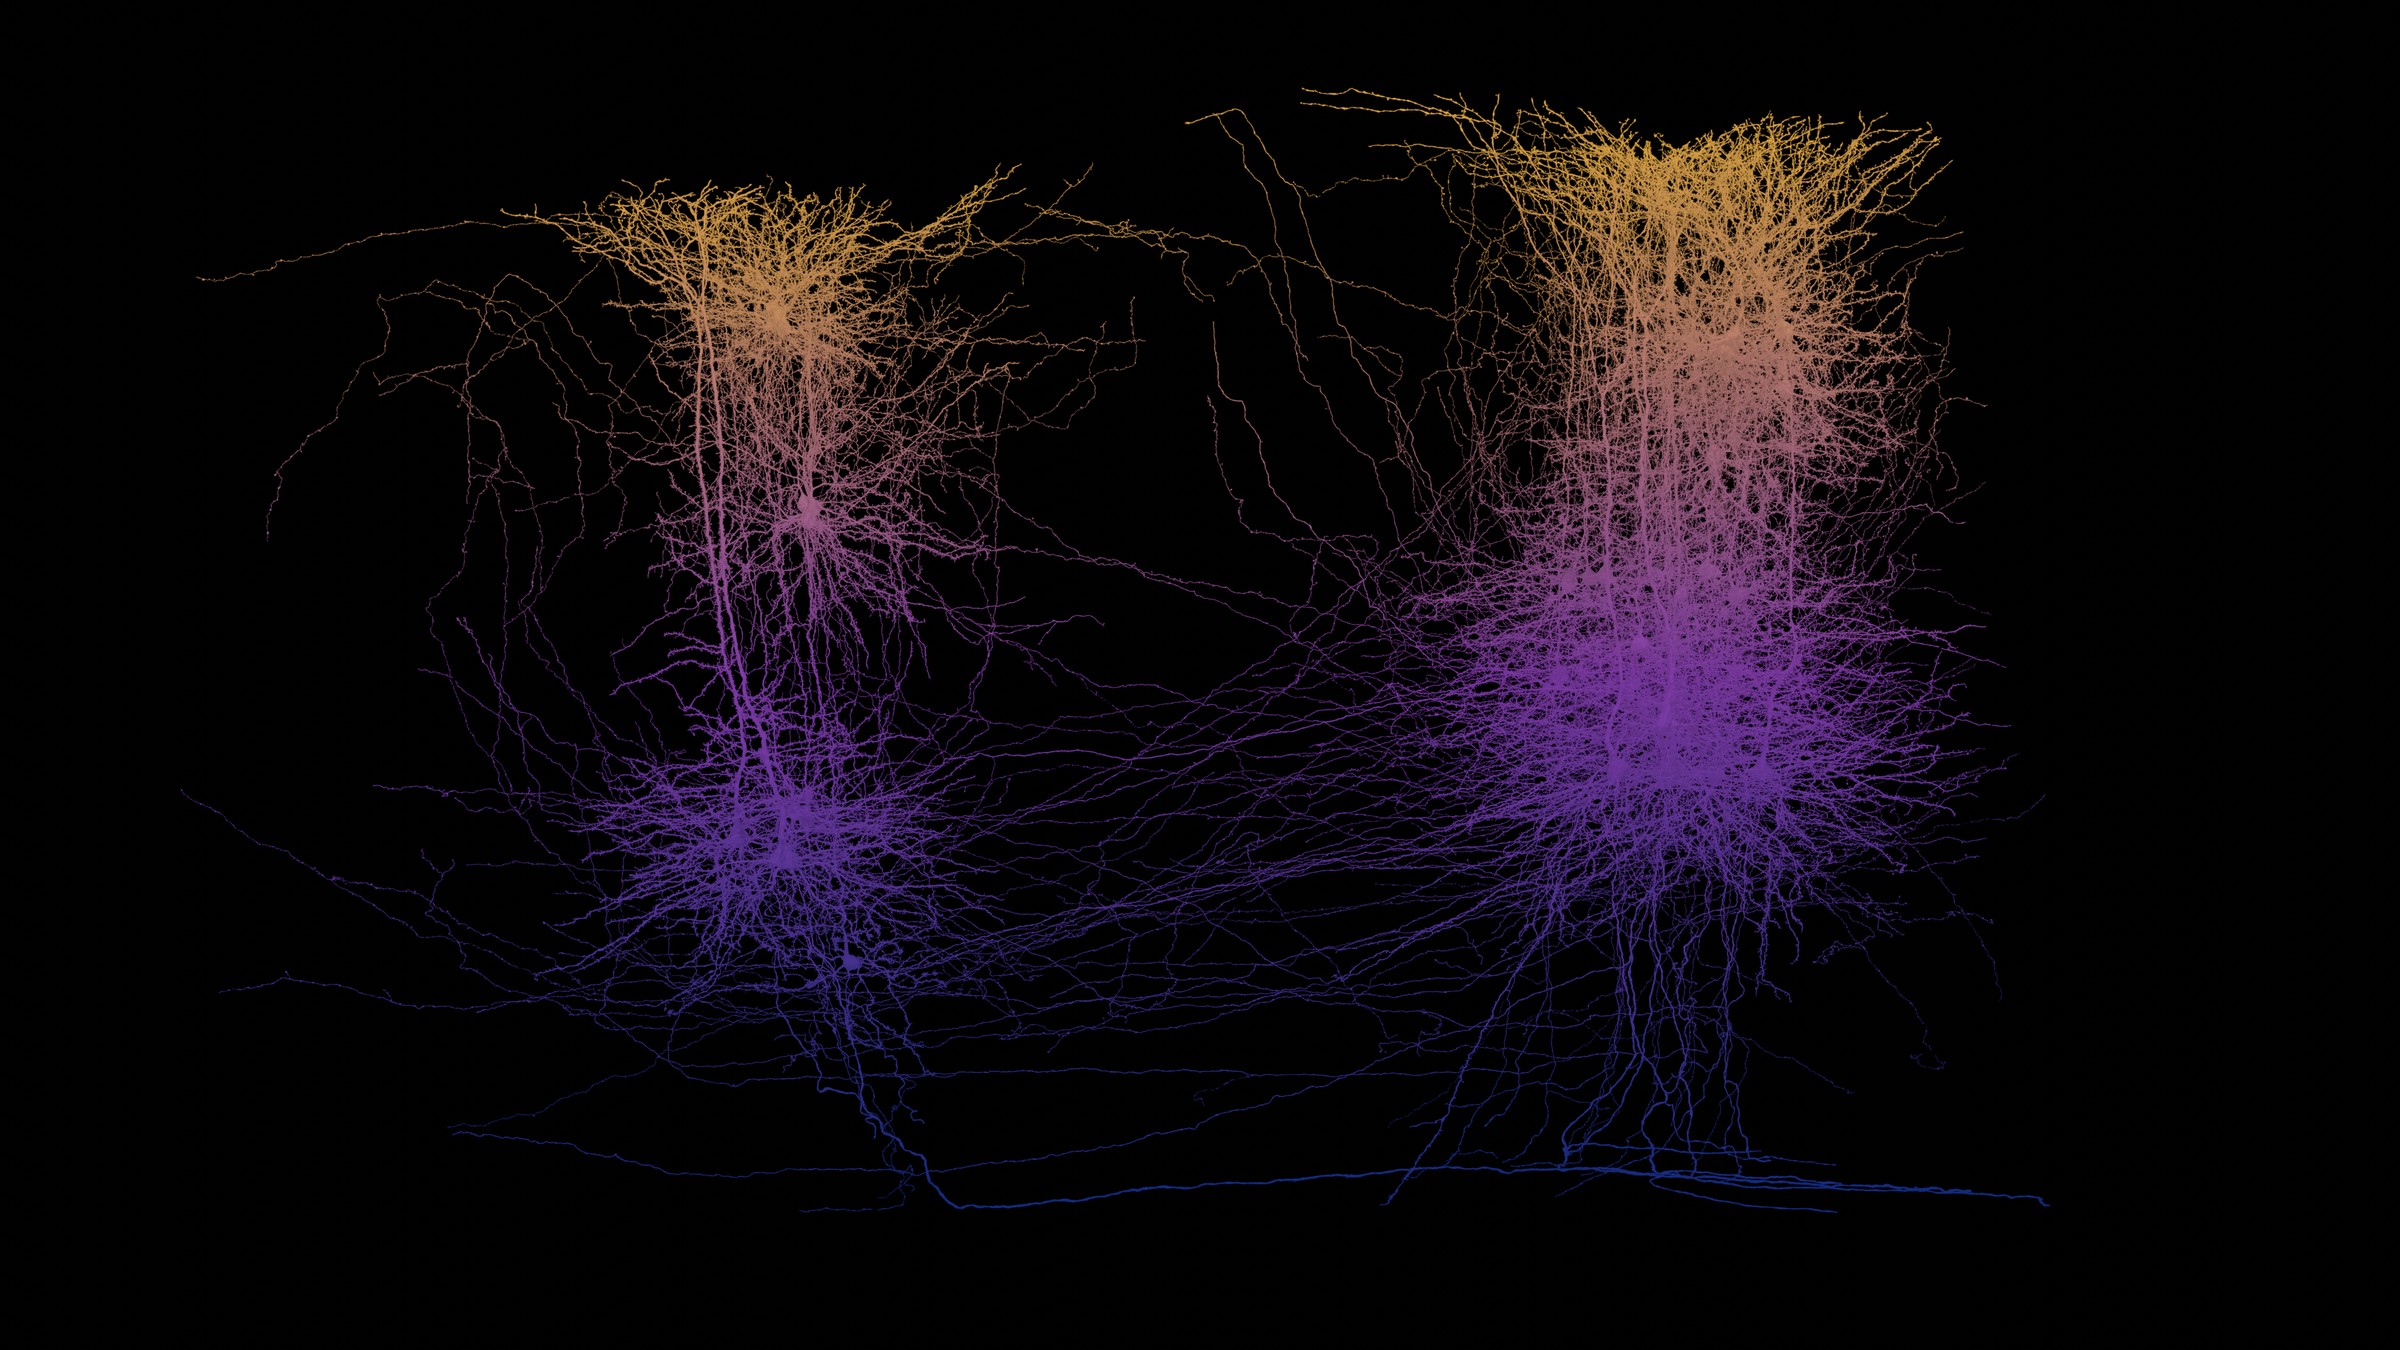
The same measured geometry, a different piece of brain. These are
proofread neurons from the MICrONS volume, coloured by how deep they sit.
38 cells481µm of cortex34 located somata809,115µm² of membrane
CAVE · minnie65_phase3_v1 · nuclei mat 1853 · synapses and types mat 1855 · 4×4×40 nm
A core through cortex
Every fully proofread neuron I hold from the MICrONS mouse visual cortex volume,
38 of them, seen side on with the pia at the top. Colour is not a property of
the cell. It is position: every point on every arbor is tinted by its own depth
below the surface, so one pyramidal neuron reads gold where its apical tuft reaches
layer 1 and blue where its soma and basal dendrites sit deep. Nothing draws the
layers in. They appear because that is where the cell bodies are.
The bright points are real somata, not estimates. Cell body
positions come from the CAVE nucleus table rather than from the meshes, because a
mesh centroid is noise inside a soma and the true coordinates are on record. The
34 located cell bodies span 429 to 910 µm below the pia with a
median of 630, which is layer 2/3 through layer 6.
This uses the same three colour stops as the CA3 convergence
gradient, reversed. There the ramp encoded a measured quantity, how many mossy
fibers reach a cell. Here it encodes position in tissue. Same visual language, two
different kinds of fact, and it is worth saying which is which.
What is honest about this picture
These cells were chosen because they are proofread, not because they are a
sample of anything. A neuron earns that status by a person checking it, so this is a
picture of 38 well traced cells, not of a cortical column. Real cortex at this
depth holds tens of thousands of neurons in the same space.
Nine of the mesh identifiers had gone stale since they were downloaded, because
proofreading keeps merging and splitting segments, and were resolved forward through
the chunked graph before the somata were looked up. Four cells have no nucleus in the
table and carry no soma marker.
Where this piece of brain came from
The volume these cells were traced in is about a cubic millimetre of mouse
primary visual cortex. It is worth seeing what that is a millimetre of. Both
surfaces below are measured, not modelled, and they are drawn in one space at
their true relative size. Drag either one to turn it; they turn
separately, because turning them together tells you nothing about either.
two brains, one spacetrue relative size
Surfaces load when you reach them
Human cortex and cerebellumMouse brainMouse V1, inside the brain, where this volume was cut
The two buttons are for a keyboard: focus one and the
arrow keys turn that brain, with shift for a bigger step. Every figure above
is arithmetic on the bounding boxes recorded beside the meshes, so it moves
if the surfaces are ever re exported.
At true scale the mouse brain is a smudge, and that is the
fact rather than a rendering problem. Press match their sizes to bring
it up to the same length and actually look at its shape. The mouse brain is
drawn as glass because the gold marker is inside it: that point is the
Allen atlas centroid of mouse V1, the region this page's 38 cells were cut
from, and it sits well below the surface rather than on it.
What kinds of cell are in it
The 38 cells in the picture at the top were chosen for being proofread, not
for being a spread of types, and painting them by depth deliberately says
nothing about what any of them is. These nine are reconstructions of nine
different kinds of cell from the same volume, each one shown whole. Two of
them are not neurons at all, which is the reason they are here: a cubic
millimetre of cortex is not made only of neurons.
Here are all 38 turning, coloured by what each one is rather than by
where it sits. The type calls come from the AIBS metamodel classifier, matched to
36 of the 38; nine of the mesh identifiers had gone stale as proofreading
continued and were resolved forward through the chunked graph before the lookup,
or they would have come back untyped rather than as an error.
The layering is still there, and that is the point. Colour here is
identity, not position, so nothing is drawing the layers in: the blue
layer 2/3 pyramidals sit high with their tufts in layer 1, the gold and green
layer 5 cells sit deep, and the bands appear because that is where each type
lives. The depth ramp at the top of this page could only ever show what it was
told. This shows the same structure arriving on its own.
The two cells that are not neurons are the reason the grey and the rose
are worth finding: one oligodendrocyte, and one Martinotti cell,
the only inhibitory neuron in the set.
Eleven of these 38 are 23P, so eleven cells share one colour.
Type separates a layer 4 pyramid from a layer 5 one; it does not separate a cell
from its same-type neighbour, and no colour scheme built on type ever will.
nine cells, one volumedrag to turn, scroll to zoom
Meshes load when you reach them
Each cell is framed to the same size on screen so the
shapes can be compared. Their real extents differ by more than a factor of
ten, and that number is in the readout rather than in the framing.
What it does
Everything above is anatomy holding still. These two are the same tissue
doing something. The first is one spike crossing one synapse, along the two
cells' own skeletons rather than along a line drawn between them. The second
is thirty seconds of activity that was actually recorded, played back on the
cells it was recorded from.
one spike, one synapsethe route is measured
Both cells load when you reach them
Press it again before the first one lands
Presynaptic cell, the one that firesPostsynaptic cell, the one that receivesThe synapse, and the origin of this scene
What this animation is not. There is no membrane
model behind it: no millivolts, no channel kinetics, no refractory period.
The spark takes four seconds to cross those two and a bit millimetres
because that is long enough to watch, and a real spike would cross them in
a few thousandths of a second. What is measured is the route and the
distances. Both meshes were re extracted in one frame centred on the
synapse, so the bright green point is a real place in a mouse brain.
thirty seconds that happenedmeasured, not simulated
Traces load when you reach them
Each dot is one cell's soma at its own coordinate in
the volume, coloured by depth on the same ramp as the picture at the top,
and brightened by its own recorded fluorescence. A calcium trace is not
a spike. It follows spiking slowly, so a bright cell is one that fired
recently, and the rise and fall you are watching belong to the indicator
rather than to the membrane. The reconstructed arbors of all 108 are here
as well, compressed from 118 megabytes to 13, and lit by the same traces.
The two views swap rather than stack, on purpose.
The dataset gives each cell a soma coordinate and an arbor mesh, and for 55
of the 108 they agree, the soma landing a median 33 µm from the
nearest point on its own branches. For the other 39 they disagree by more
than 100 µm, out to 702, so one of the two has gone stale against a
later segmentation. That is the same drift that left nine of this page's 38
identifiers needing to be resolved forward. Each layer is sound on its own,
since the mesh and the trace share a segment id and the soma and the trace
share a manifest row. Drawn together they would put 39 dots visibly adrift
from their own branches, so you get one or the other.
MICrONS, mouse visual cortex
Data from the MICrONS Consortium, served through
microns-explorer.org.
Meshes and soma positions queried from CAVE, datastack
minnie65_phase3_v1.
Back to the CA3 renderings